The report is designed to be run on a weekly/bi-weekly basis and will help you manage your stock so that you have less cash tied up in badly performing products.
Step-by-step guide
To view this report go to Manager > Reports > Additional Reports > Multi Branch > Product Performance (Multibranch)
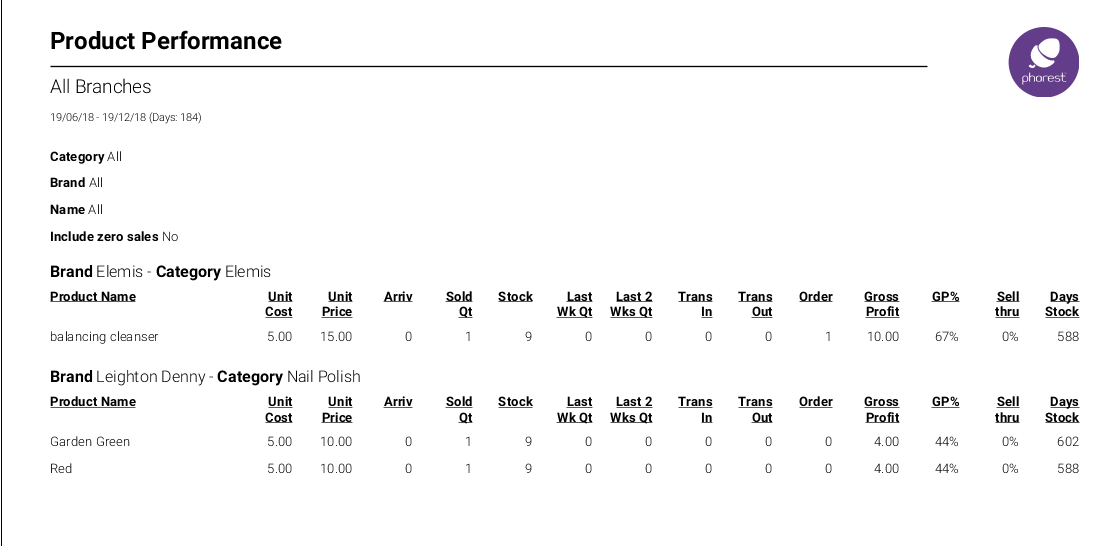
Here is an example:
Overview
- Product Name: This is the product name.
- Unit Cost: This is the cost price as displayed in the Stock panel(VAT included).
- Unit Price: This is the sale price as displayed in the Stock panel(VAT included).
- Arriv: This is the number of product items delivered in the given period of time.
- Sold Qt: This is the number of product items sold in the given period of time.
- Stock: This is the number of product items currently in store, Stock On Hand.
- Last Wk Qt: This is the number of product items sold 7 days back from today (included).
- Last 2 Wks Qt: This is the number of product items sold 14 days back from today (included).
- Trans in: This is the number of product items transferred from different branches in the given period of time.
- Trans out: This is the number of product items transferred to different branches in the given period of time.
- Order: This is the number of product items currently on order.
-
Gross Profit: This amount is given by the total gross amount sold in the given period of time minus the total cost of items sold in the same period.
The total cost of items is given by the quantity of items sold in the period multiplied by the cost of every items.
Suppose we have a product A that we sale at price AP and cost AC, and a product B that we sale at price BP and cost BC. Assume that in the given period of time we sold 10 products A and 5 products B.
The gross profit in the period is 10 * (AP - AC) + 5 * (BP - BC) -
GP%: This is the gross profit percentage and it is obtained dividing the Gross Profit by the total cost of items sold in the same period.
From the example above the GP% is [10 * (AP - AC) + 5 * (BP - BC)] / (AC + BC) - Sell thru: This is the quantity of product items delivered in the given period of time divided by the quantity of product items sold in the same period of time.
- Days Stock: This is the number of days since the last order.