To learn about more areas like this in your Phorest system enrol in our Products & Inventory series in Phorest Academy - online, on-demand and on-the-go learning for busy salon professionals.
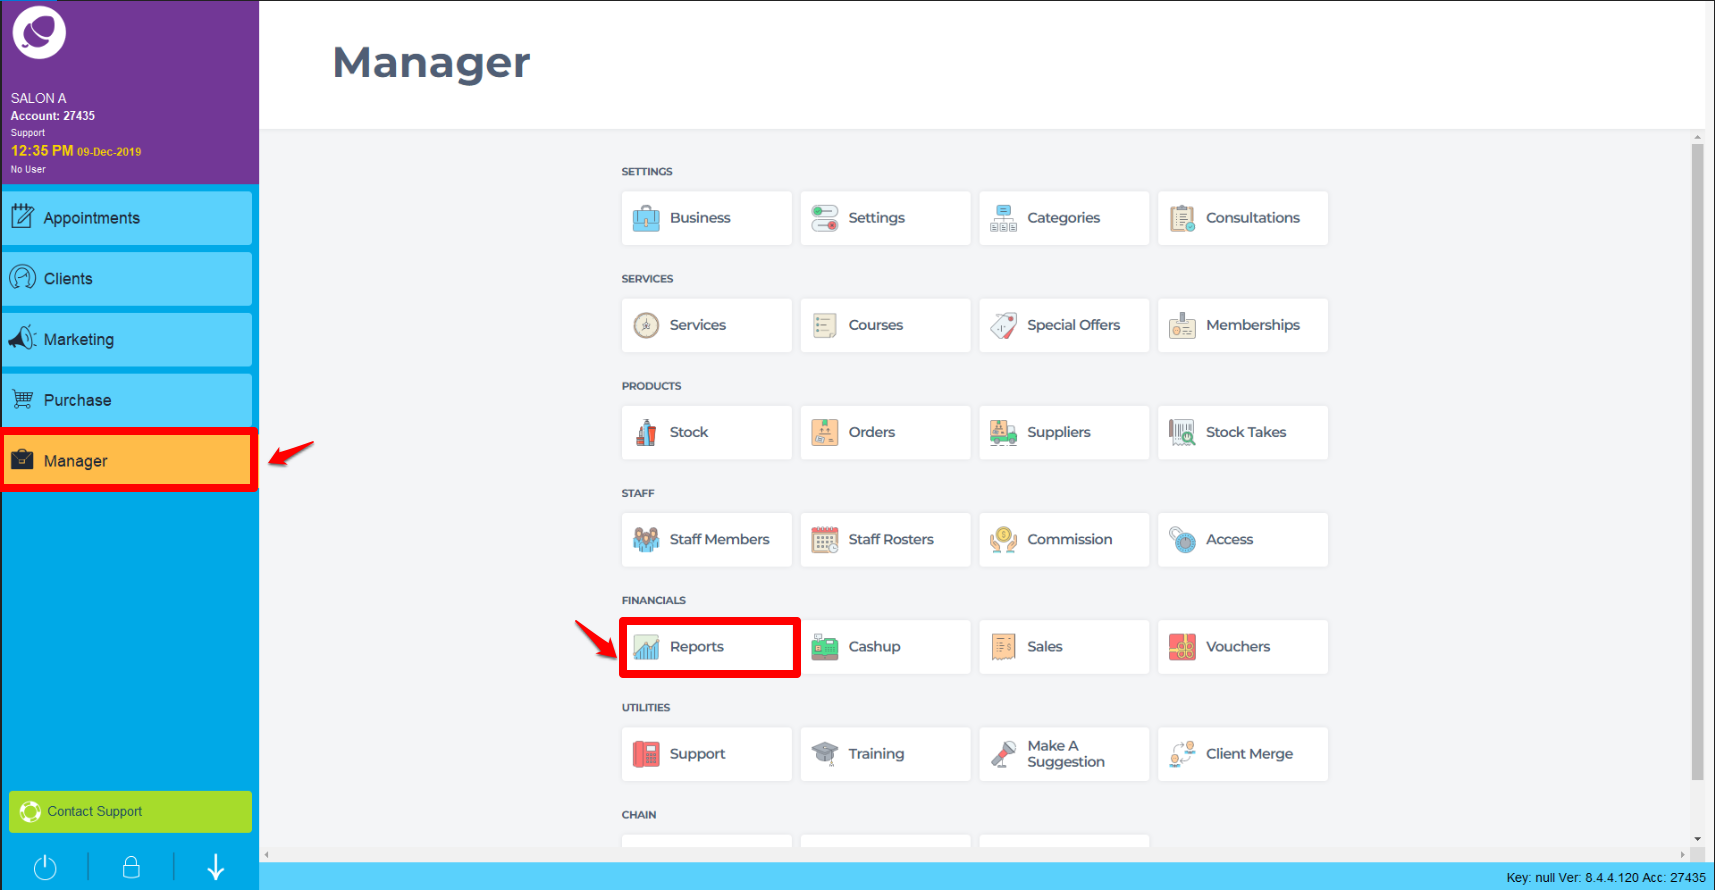
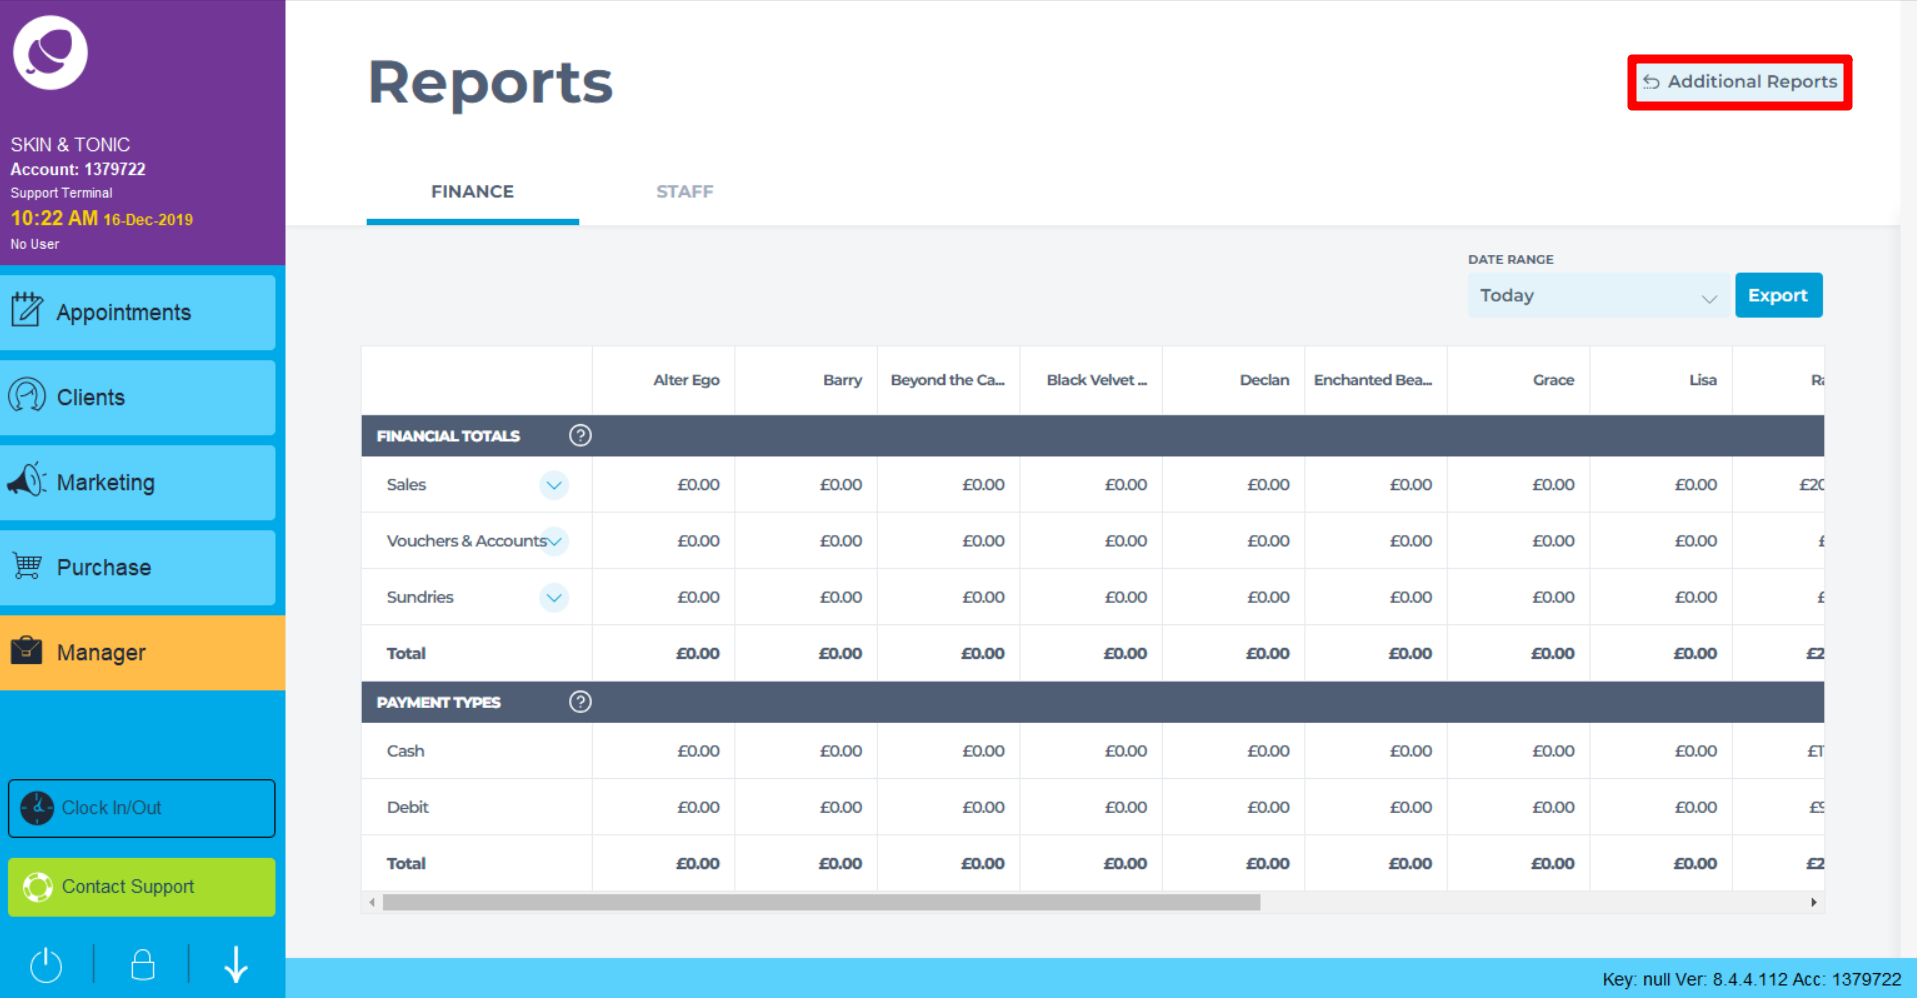
To run this report go to Manager > Reports > Additional Reports.


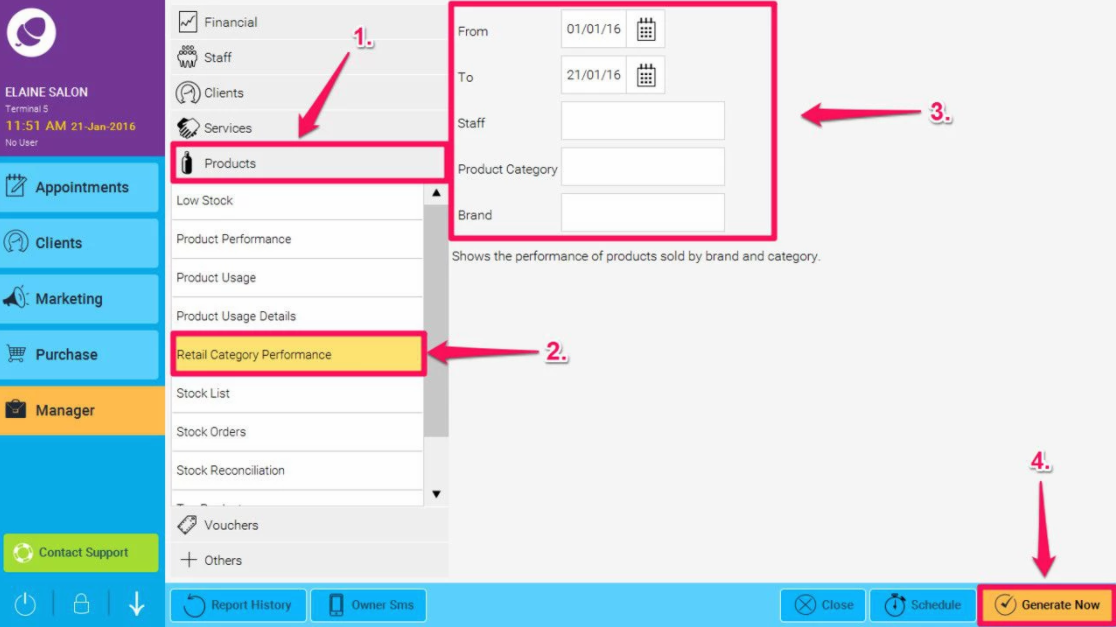
Click on Products (1), highlight the Retail Category Performance Report (2), choose the dates (3). Click on the Generate Now (4.)

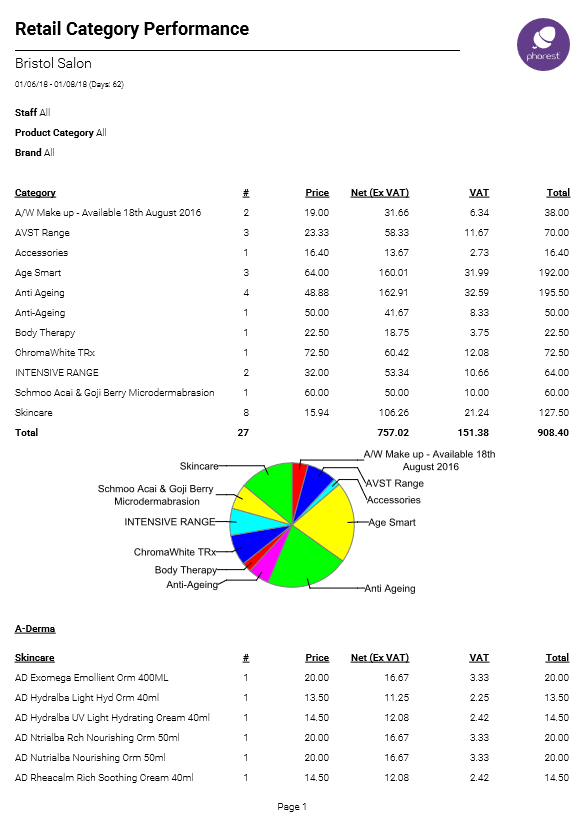
This report is divided into two sections:
- The first shows the number and the amount of Products sold in the given period of time and grouped by Category. A pie-chart displays the proportion between each Product Category total gross amount.
- The second section shows the detail of each single Product grouped by Brand and Category.

To learn about more areas like this in your Phorest system enrol in our Products & Inventory series in Phorest Academy - online, on-demand and on-the-go learning for busy salon professionals.