This report shows the top Services in the given period of time that generated the highest Revenue or Profit depending on which filter is selected at the time the report is generated. The number of Services displayed depend on the filter options too. Courses and Service Rewards (Services paid by points as specified by the Matrix rewarding system) are excluded from the calculation.
Step by Step Guide
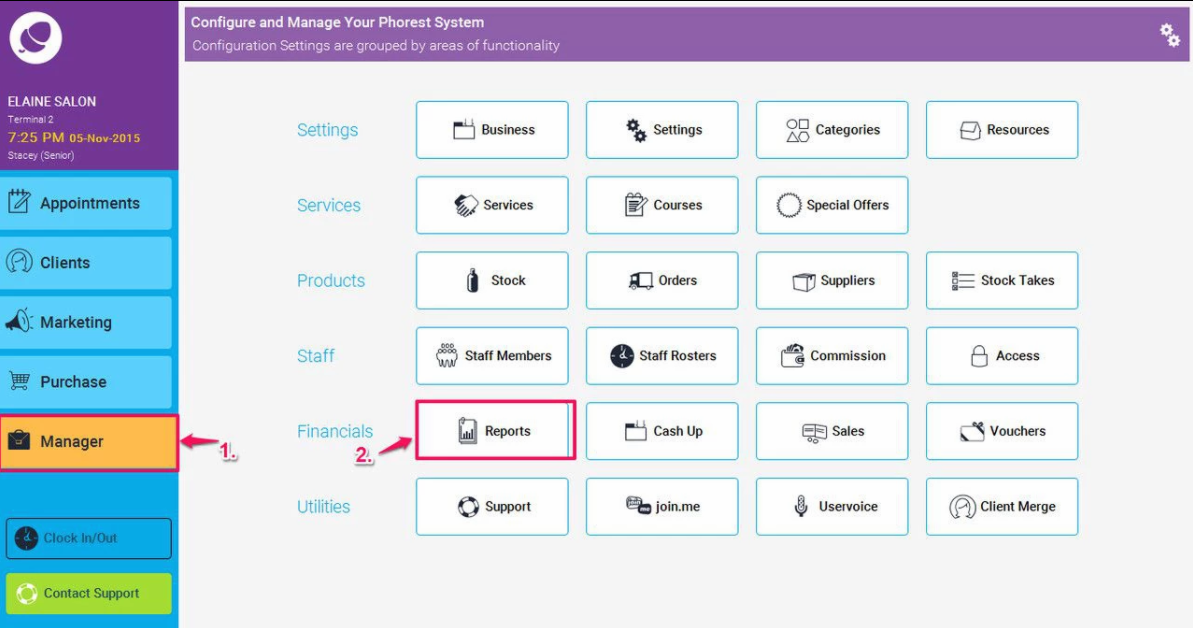
To view this report go to Manager > Reports > Return to Old Reports
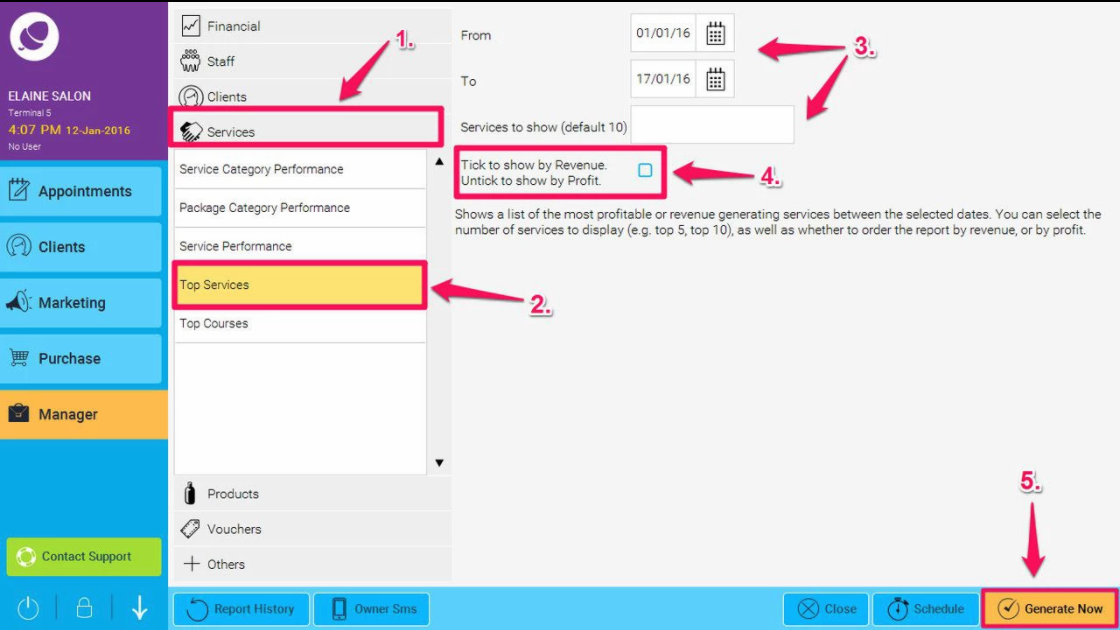
Then choose: Services > Top Services, then enter suitable dates you wish to run the report for, the number of services to show (or you can leave this blank to show the default of 10), and then choose if you would like to run the report by revenue or profit, by ticking the check box shown in point 4 below as desired. Finally click the Generate Now button to run the report.
Overview
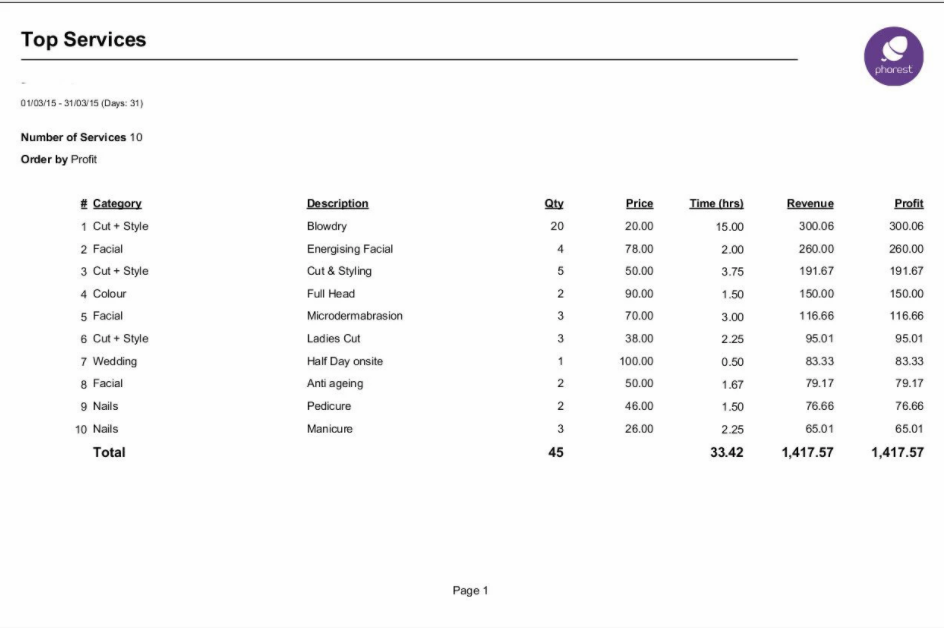
- Category: This is the Service Category.
- Description: This is the Service description.
- Qty: This is the quantity of Services that have been sold in the given period of time.
- Price: This is the current Service price per unit.
- Time (hrs): This is the sum (in hours) of the duration of all Services carried over the given period of time. This is not the actual time spent during the Appointments, but the estimated duration as declared during the Service configuration.
- Revenue: This is the total net amount of all Services sold in the given period of time.
-
Profit: This is the total net amount of all Services sold in the given period minus the total cost.
There is an important observation to note here: Phorest doesn't currently keep track of Services cost variations. The cost used to calculate the Profit is then the current Service cost at the time the calculation is made. The Profit displayed by the report is then a close estimation of the real figure, assuming that the cost of Services haven't changed too much during the period the report is run.