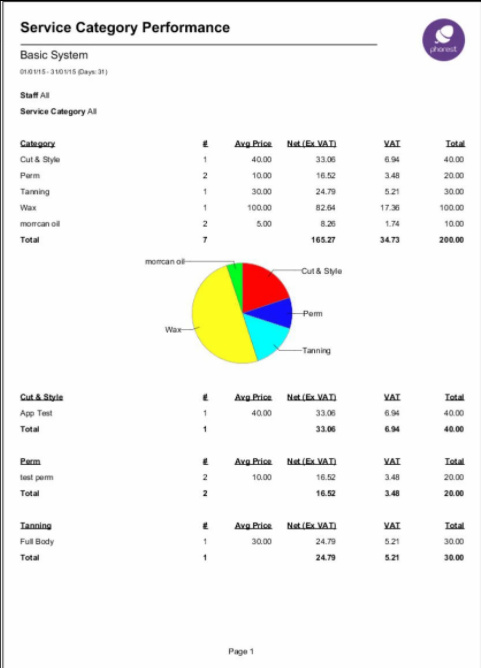
This report shows the total revenue for each service category between the selected dates. It also breaks down the revenue per service. A pie chart represents the percentage performance between each category.
Step by Step Guide
To view this report go to: Manager > Reports > Return to Old Reports > Services > Service Category Performance
The report is divided into two sections:
- The first shows the number and the amount of Services sold in the given period of time and grouped by Category. A pie-chart displays the proportion between each Service Category total gross amount.
- The second section shows the detail of each single Service grouped by Category.
Overview
Category: This is the Service Category.
#: The number of Services sold in the given Period of time.
Avg Price: This is the Service current price per unit.
Net (Ex VAT): This is the total net amount of Services sold in the given period of time.
VAT: This is the total VAT amount of Services sold in the given period of time.
Totals: This is the total gross amount of Services sold in the given period of time.