The Staff Transaction Detail report shows a detailed analysis for each staff member in relation to what they did between any two dates specified.
This report can be filtered to contain specific information, i.e. brand, product category, service category or staff member.
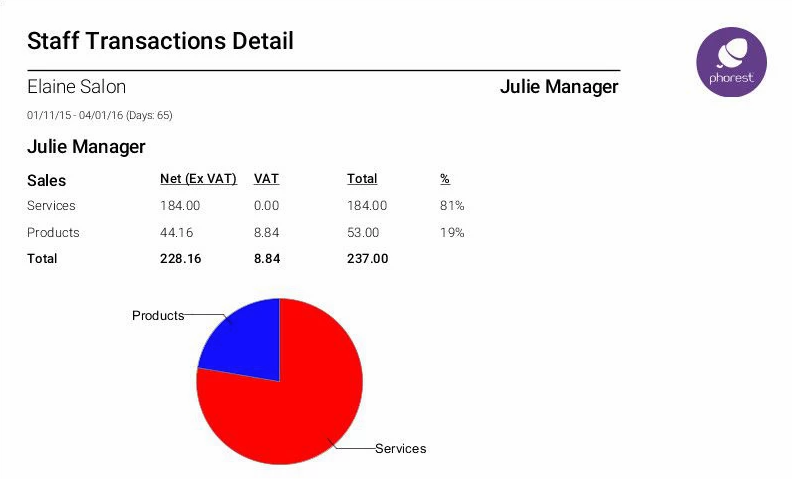
Upon running the report you will see a general overview showing the total services, courses and products sold,
In addition to a pie chart comparing the totals against each other as a ratio. Please see below.

Staff Transaction Detail Report Breakdown
(Please note that for Courses the report uses the amount generated at the time the course is sold and not the amount at the time a course session redeemed)
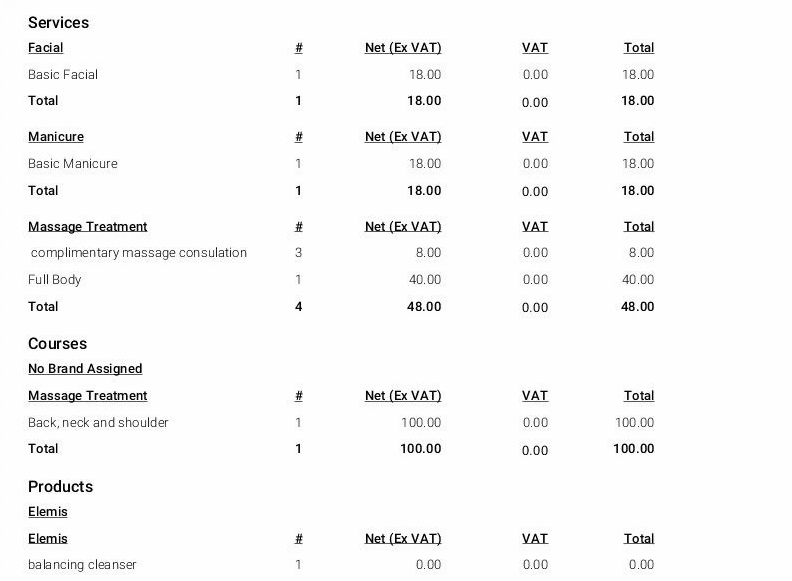
Following this you will have breakdown of the services, courses and products sold. These are all listed by category and by brand as shown below.
Please see below for an example of the Staff Transaction Detail report in addition to a breakdown of each section.
# - The number of client visits in a given period
Sales - Breakdown of services, courses & products in seperate categories
Tax/VAT - Financial levy applied to services & products
% - Total amount of service, courses & products sold as a percentage
Gross - Total amount before deductions
Net - Total amount remaining after deductions
Total - This is the sum of all services, courses and products sold by a staff in the given period of time.

