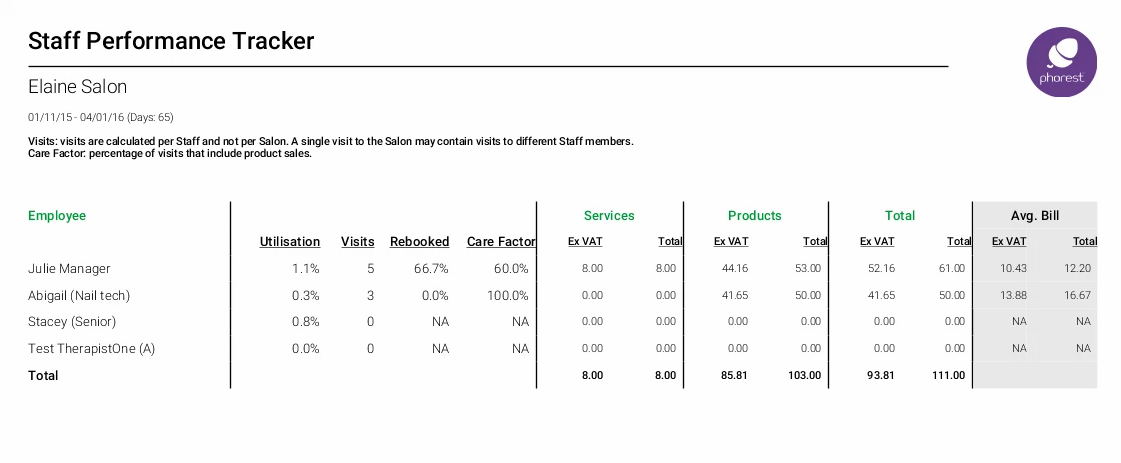
The Staff Performance Tracker report shows a summary of each staff members performance between any two dates.
This report can be accessed via Manager > Reports > Return to Old Reports > Staff
Things To Note:
- Visits are calculated per staff and not per salon. A single visit to the salon may contain visits to different staff members.
- The Care Factor is the percentage of visits that include product sales
Staff Performance Tracker Breakdown
The report will summarise each staff members performance in a number of areas including their utilisation, care factor, service totals, products totals etc. An example of the report can be seen below in addition to an explanation for each heading/figure shown.
- Employee - Lists all staff members currently set up on the system.
- Utilisation - This value is obtained dividing the Staff Total Time Worked (in seconds) by the Staff Total Working Time (in seconds). The result is given as a percentage to show how much of a staff members time is spent on performing services.
- Visits - are counted as unique guest visits per day. If a single client has 1 sale for a service, and another sale for a product on the same day, this will be counted as a single visit.
- Rebooked - The number displayed is the percentage of all staff client rebooking's vs the total staff client visits for the salon. This figure is calculated if a client books an appointment for a future day, or has an appointment booked for a future day at the time of their visit.
- Care Factor – The staff care factor is the percentage obtained from dividing the number of staff client visits with a product purchase in a given period by the total number of staff client visits in the same period.
- Services - This is the amount of services and courses sold in a given period of time. For courses the amount displayed as part of the total figure is the amount paid through at the time of the course being purchased.
- Products - This is the amount of products sold in a given period of time.
- Total - This is the sum of all services, courses and products sold in a given period of time.
- Avg Bill - This figure is calculated by dividing the figures contained within the Total column by the total number of Visits.
