The staff utilisation report is designed to show you how staff members are performing in terms of utilising their scheduled time and generating revenue.
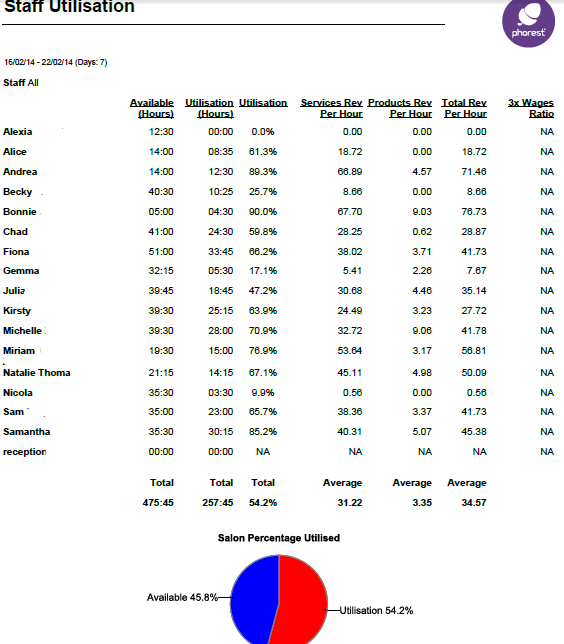
Staff lists out all the staff members that had a schedule during the dates selected
Available hours shows the number of hours each staff member was scheduled to work during the dates selected
Utilisation hours shows the number of hours each staff member was booked for appointments between the dates selected.
Utilisation is the percentage of time the staff member was booked out against their schedule, the schedule is viewed as the 100% of time available figure. The % utilised is the % of time that the staff member was booked out over each one.
Totals gives a total on each of the sections above for all staff members combined.
Services Revenue per hour lists out the average revenue each staff member generated during the dates selected on services per hour
Product Revenue per hour lists out the average revenue each staff member generated during the dates selected on products per hour
Total per hour is a total average revenue per hour each staff member is generating on services and products
3X Wages rule
The 3X wages rule is a rule that defines for a business to break even each staff member must be generating 3 times their hourly wage in revenue per hour. If a staff member is not generating this on average the business is potentially losing money.
This section shows the amounts each staff member is above or below their target of the 3X rule
Averages shows a total combined average on each of the sections above for all staff members
Salon % utilised pie chart represents the time utilised overall by staff, the full chart is 100% of the time scheduled. This is broken down by Availability percentage, and Utilisation Percentage for the whole salon (All staff)
3X Wages Rule Above/below baseline Graph
This sections displays the amounts each staff member is above or below the baseline target of breaking even for the business.