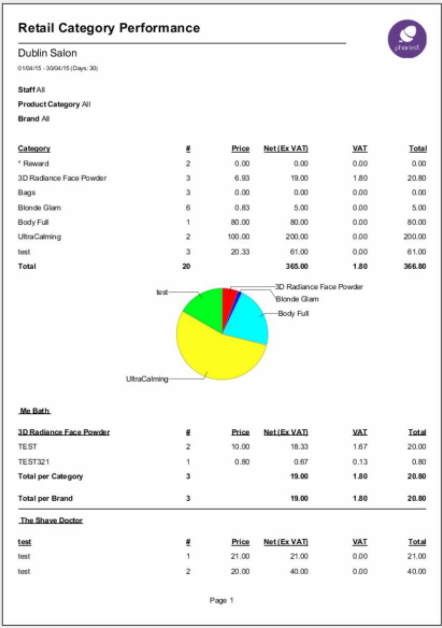
Shows the performance of products sold by brand and category.
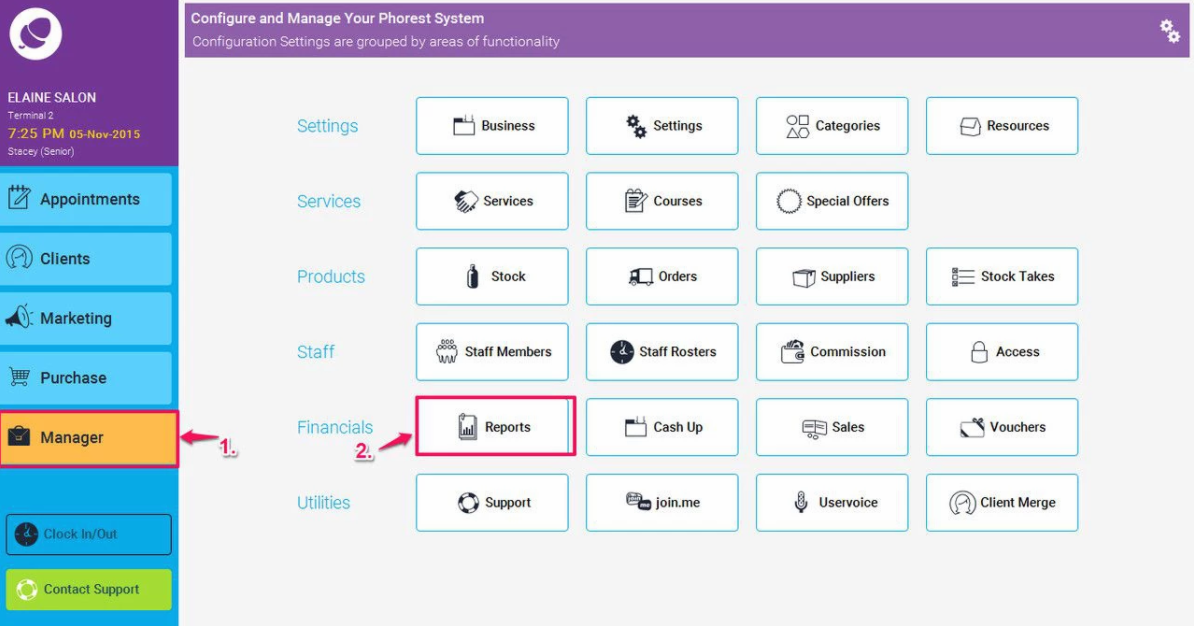
To run this report go to Manager>Reports

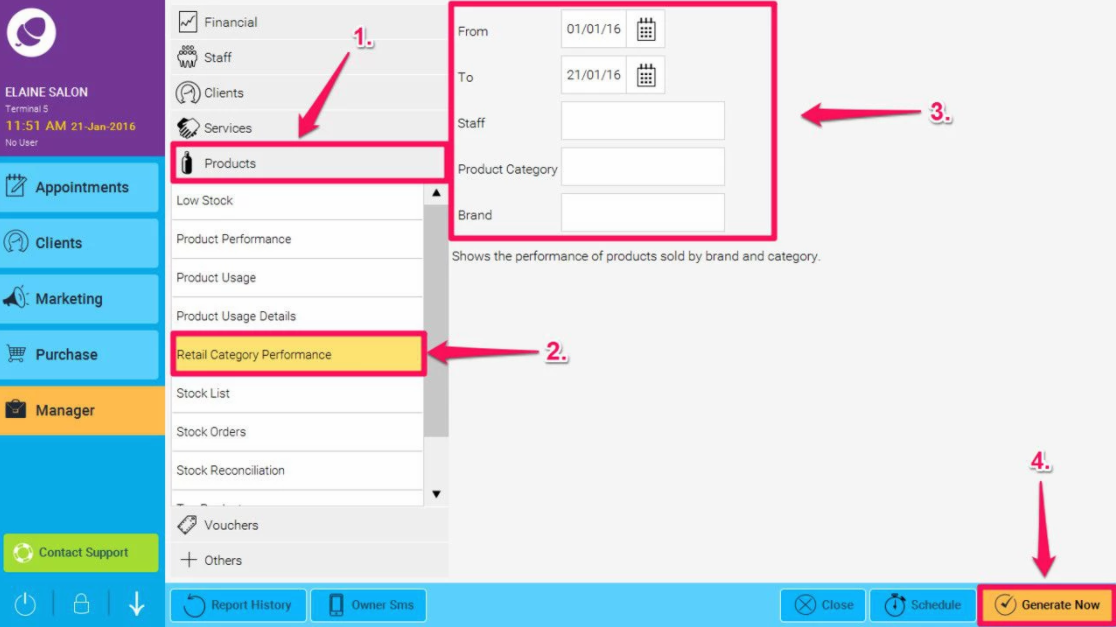
Then click on Products (1), and then highlight the Retail Category Performance Report (as shown in point 2 below), then choose the dates for which you want to run the report, and select the correct details (or leave them blank to show all as shown in point 3. below). Finally click on the Generate Now button (4.)

This report is divided into two sections:
- The first shows the number and the amount of Products sold in the given period of time and grouped by Category. A pie-chart displays the proportion between each Product Category total gross amount.
- The second section shows the detail of each single Product grouped by Brand and Category.

