This report analyses how your products are performing from a sales and also stock control point of view(e.g how fast are products moving off the shelves).
The report is designed to be run on a weekly/bi-weekly basis and will help you manage your stock so that you have less cash tied up in badly performing products.
To run this report go to Manager>Reports
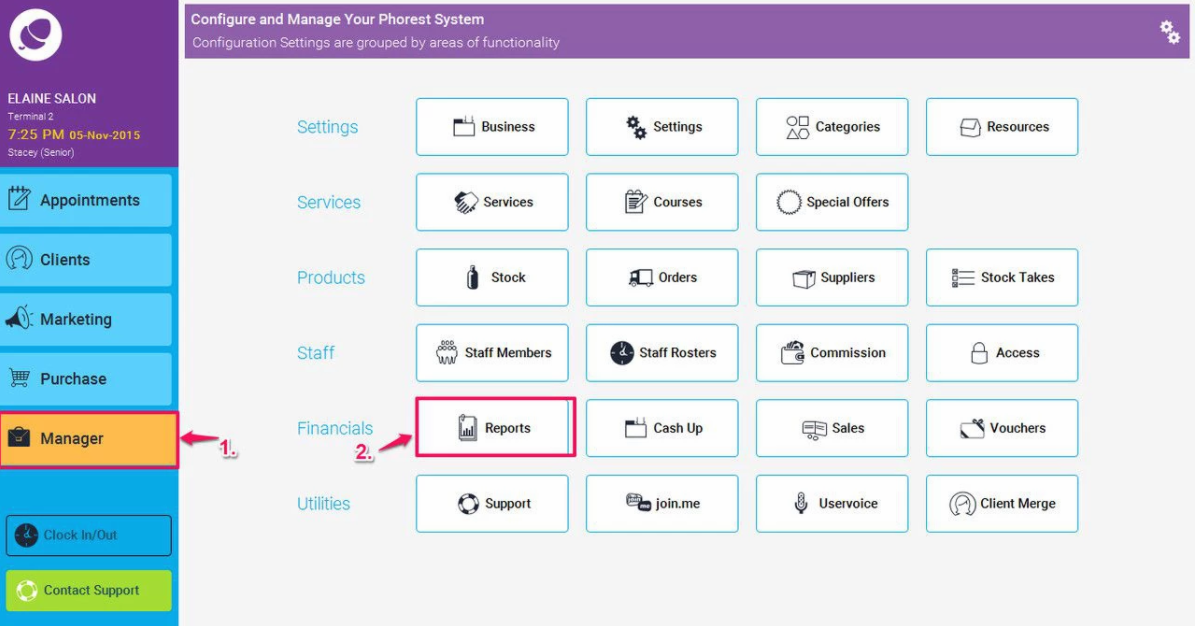
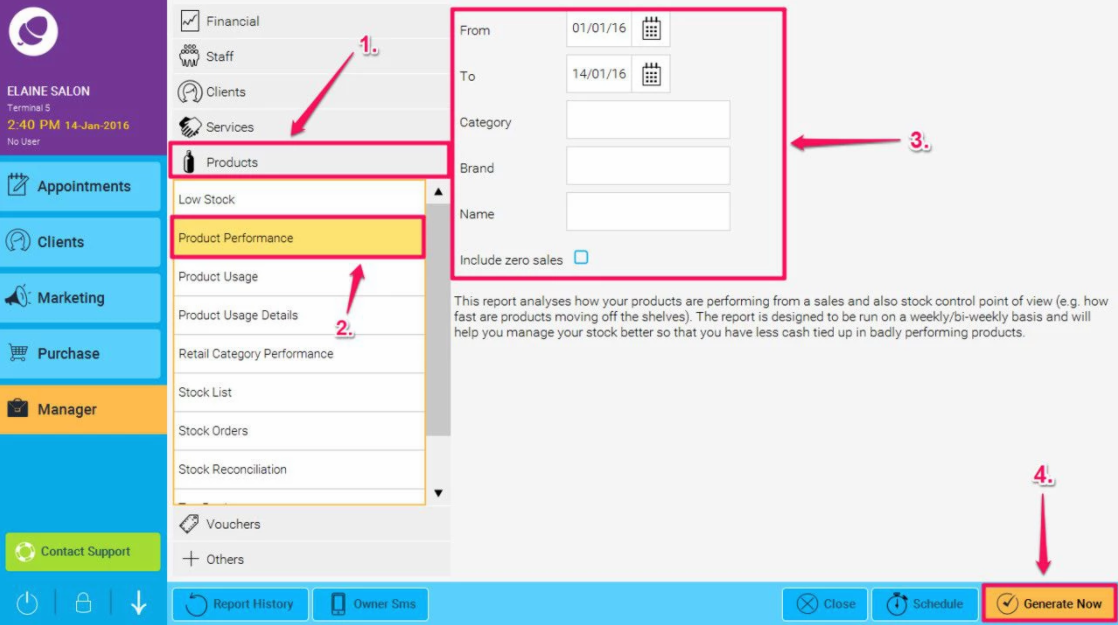
Then Click on Products (1.) and highlight the Product Performance Report (as shown in point 2. below), then choose your report options or leave them blank to show all details (as shown in point 3. below) and finally click the Generate Now button (4.)
The report will then run, here is an example:
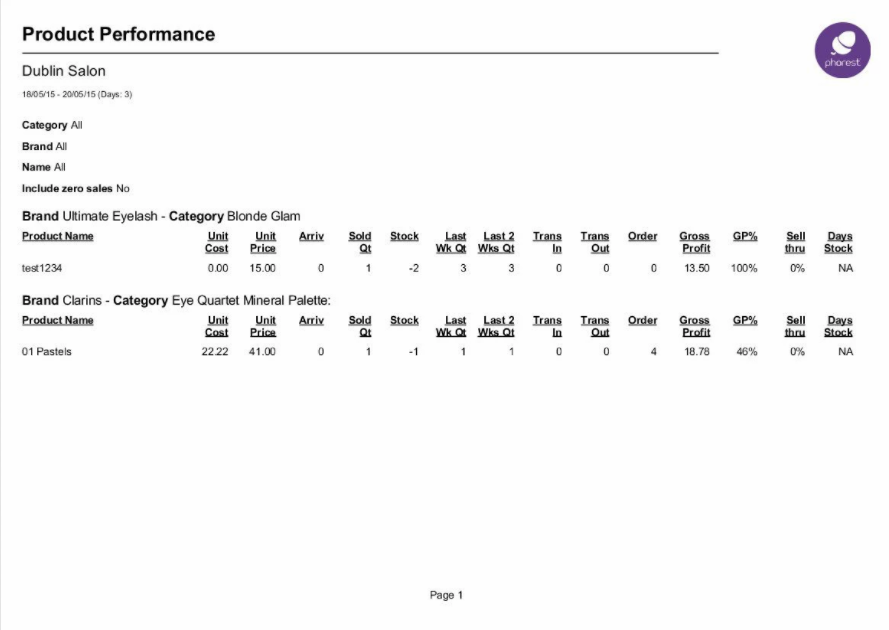
Product Name
This is the product name.
Unit Cost
This is the cost price as displayed in the Stock panel(VAT included).
Unit Price
This is the sale price as displayed in the Stock panel(VAT included).
Arriv
This is the number of product items delivered in the given period of time.
Sold Qt
This is the number of product items sold in the given period of time.
Stock
This is the number of product items currently in store, Stock On Hand.
Last Wk Qt
This is the number of product items sold 7 days back from today (included).
Last 2 Wks Qt
This is the number of product items sold 14 days back from today (included).
Trans in
This is the number of product items transferred from different branches in the given period of time.
Trans out
This is the number of product items transferred to different branches in the given period of time.
Order
This is the number of product items currently on order.
Gross Profit
This amount is given by the total gross amount sold in the given period of time minus the total cost of items sold in the same period.
The total cost of items is given by the quantity of items sold in the period multiplied by the cost of every items.
Suppose we have a product A that we sell at price AP and cost AC, and a product B that we sell at price BP and cost BC. Assume that in the given period of time we sold 10 of product A and 5 of product B.
The gross profit in the period is 10 * (AP - AC) + 5 * (BP - BC)
GP%
This is the gross profit percentage and it is obtained dividing the Gross Profit by the total cost of items sold in the same period.
From the example above the GP% is [10 * (AP - AC) + 5 * (BP - BC)] / (AC + BC)
Sell thru
This is the quantity of product items delivered in the given period of time divided by the quantity of product items sold in the same period of time.
Days Stock
This is the number of days since the last order.
