This report assigns commission to the stylist for both the cut and the colour, regardless of whether they performed the colour part of the treatment. The colourist will receive no commission in this case. The report will show course session's as they are redeemed rather than showing the course amount in full at it's time of purchase.
This report gives a breakdown of each staff members performance between two dates. This report will only show services that have a service category from the HAIR category assigned to them (e.g Colour, Hair Treatment, Styling).
Stylists Performance Detail Report Breakdown
An example and breakdown of the report can be seen below.
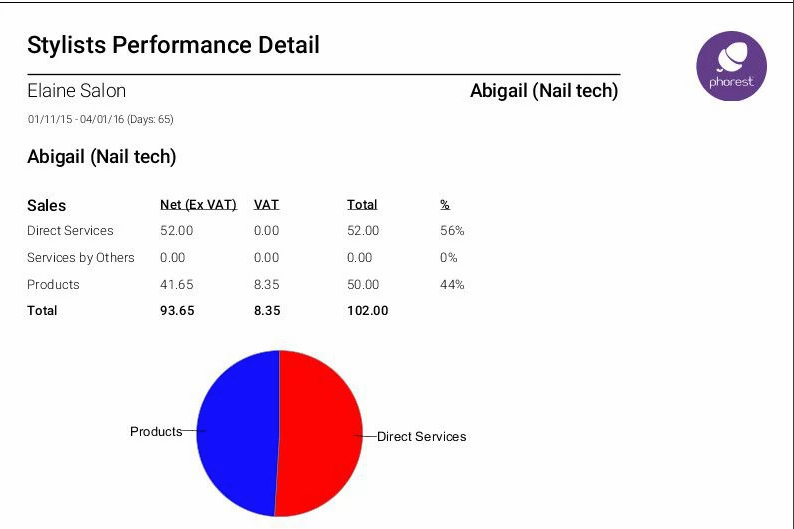
- Sales - This is used to group the items sold in three subsets: Direct Services, Services by Others and Products.
- Net (ex VAT) - This is the total net amount of Direct Services, Services by Others or Products sold by the staff member in the given period of time.
- VAT - This is the total VAT on Direct Services, Services by Others or Products sold by the staff member in the given period of time.
- Total - This is the total gross amount of Direct Services, Services by Others or Products sold by the staff member in the given period of time.
- % - This is the percentage obtained from dividing the total net amount for a specific group of sales (Direct Services, Services by Others and Products) in the specified period by the total net amount of all group sales in the same period.
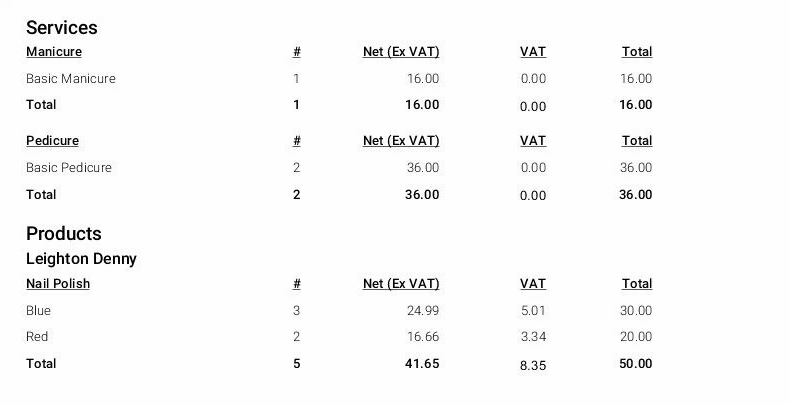
- Services - This section breaks down the individual sales that contributed to the overall service sale amount listed at the beginning of the report.
-
Products - This section breaks down the individual sales that contributed to the overall product sale amount listed at the beginning of the report.
The Pie Chart is designed to show the ratio of service sales to product sales for the displayed staff member