The Sales by Category reports is designed to show you the percentage of revenue each type of sale is making for the business.
Step by Step Guide
To view this report go to Manager > Reports > Financials > Sales by Category
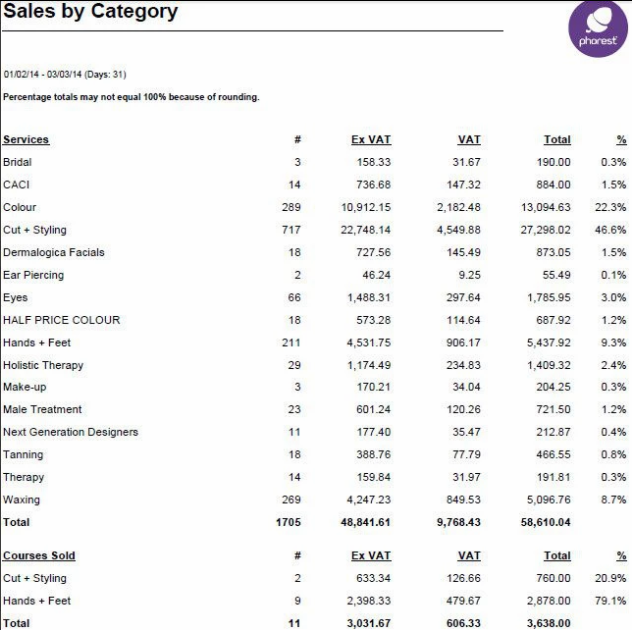
Services
This sections lists out your service categories from top to bottom based on which service categories generated the most revenue.
- It gives you the quantities of services sold within each service category
- Next it has the Net values generated along with the vat incurred.
- After that we have a total for Net plus vat.
Finally it gives you a % rate of revenue generated under each service category, this can indicate to you what your most popular services are between the dates selected.
Courses Sold
The courses Sold Section shows courses sold using the same breakdown as Services
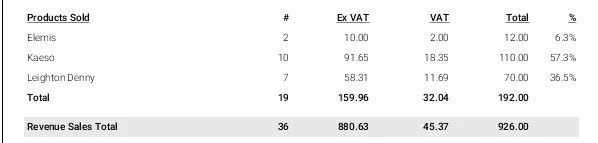
Products
The products section gives you the same run-down for revenues generated on products as services above.
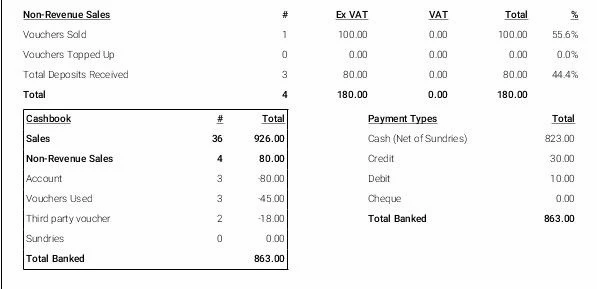
Non - Revenue Sales
This displays the number of vouchers and deposits sold along with the Net price in total
The non-Revenue Sales in the first area shows a total of 180 and only 80 in the Cash Book section.
The reason for this is because the Cash Book section shows the total non-revenue sales minus the discounts applied.
Payment breakdown
This section gives you a breakdown of how the revenue was brought in based on all your different payment methods